
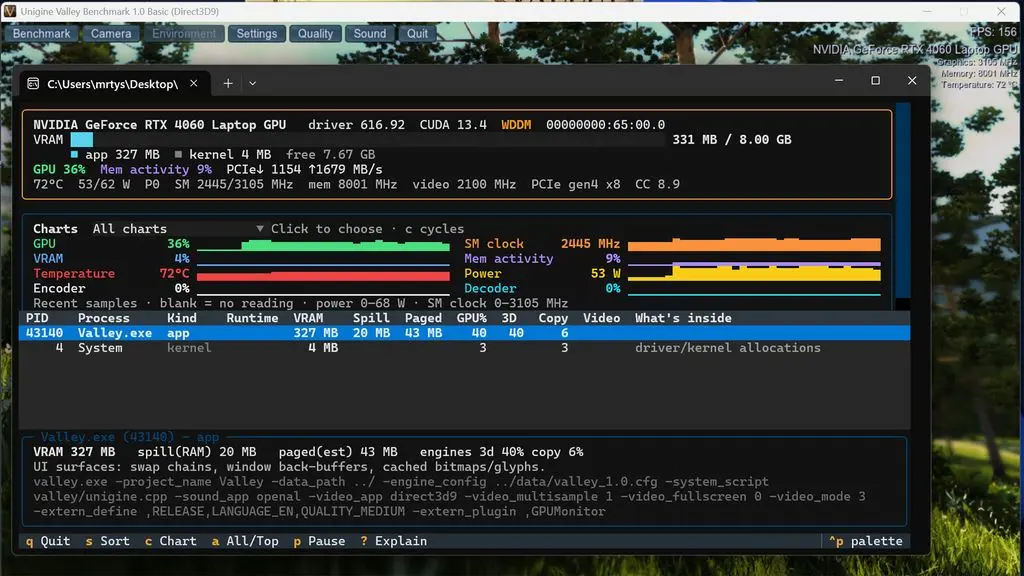
Often, developers and power users struggle to know what specific processes are eating up video RAM. To bring this type of observability to Windows (as well as Linux and MacOS), Microsoft just launched an open-source utility called gputaskman. This utility gives real-time per-process GPU usage data that helps users involved in complex AI workloads and graphics applications.
New utility tracks per-process GPU usage and AI workload memory
Version 0.3.0 of this software is available under the permissive MIT license. The software was developed by Microsoft's VP Scott Hanselman. He wanted to understand where his GPU memory was being consumed during high-intensity tasks.
- Supported Operating Systems: Windows, Linux, macOS
- License: MIT
- Current Version: v0.3.0
Hanselman called this experimental software. He encouraged others to contribute to the software in order to make it even better.
gputaskman offers a lot of information such as VRAM usage, active runtimes and specific info for AI/LLM workloads. There's a lot of detail available about AI models, such as the weight sizes, KV cache, overall number of parameters and much more. This helps to understand exactly what applications or background processes might be gobbling up memory.
Microsoft has portable Windows download available along with the Linux and MacOS support. Hanselman suggested the possibility that enhanced GPU observability may become a standard part of Windows in the future. For now, users can download the tool from GitHub and immediately see what's happening with GPU resource usage on the system.

Linux support is solid but Proton games with anti-cheat will still crash when this hooks into the driver layer. You need native WSL2 for clean AI workloads.
Does the v0.3.0 build handle GPU memory fragmentation correctly or just show total allocation? I need to see if my KV cache is actually pinned.
It tracks per-process VRAM usage and active runtimes. The breakdown includes weight sizes and parameter counts so you can isolate the memory hogs.